Caldera Technical Note #01
Process Maps from Sparse Experiments
Turning limited experimental tables into interpretable multivariate process maps with AI-assisted inference.
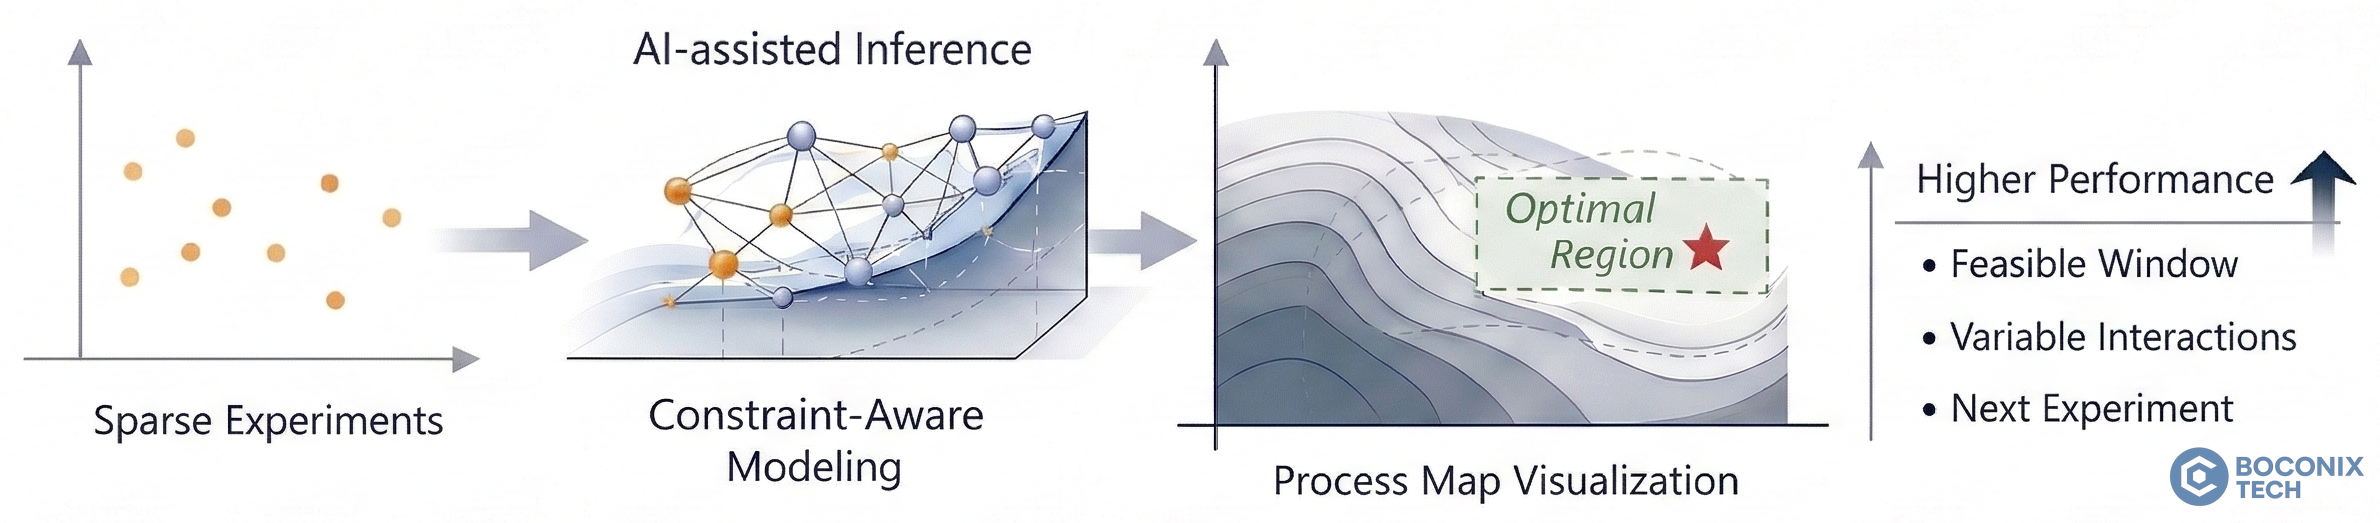
Figure 1. Converting sparse experimental runs into interpretable multivariate process maps using AI-assisted, constraint-aware modeling.
Sparse-Data Reality
In early-stage development, datasets are typically small and unevenly distributed.
Teams often work with only a handful to a few dozen runs, frequently with:
- multiple variables changing simultaneously
- noisy measurements
- incomplete coverage of the process space
Despite limited data, engineers still need to answer practical questions:
- Which variables appear more influential?
- Where might candidate operating regions emerge?
- What direction should the next experiment explore?
Limitations of One-Variable Analysis
Teams often start by inspecting experimental tables with one-variable plots—for example, Temp. → Performance or Time → Yield.
While intuitive, these plots can miss interaction effects: cases where the impact of one variable depends on the level of another.
In real process development, key behaviors are often driven by coupled inputs, such as:
- Temperature × Atmosphere
- Concentration × Residence Time
As a result, “one knob at a time” views can hide the structure that matters for candidate-region selection and trade-off decisions.
Multivariate Process Maps
Caldera approaches sparse datasets using an AI-assisted process-map perspective: how multiple inputs jointly influence system behavior.
Instead of examining variables independently, the goal is to understand the combined structure of the process space. Even with limited experimental runs, the available measurements can help reveal how different process knobs jointly shape system behavior within the explored domain.
Practically, this perspective turns sparse experimental tables into a continuous, decision-ready view of the explored domain. The resulting map provides an interpretable representation of how outputs evolve across combinations of input conditions.
From this map, engineers can examine several aspects of system behavior:
- Directional behaviorHow performance changes when moving across the process space. This reveals increasing or decreasing trends with respect to specific variables.
- Relative influence of variablesSome variables exert stronger control over system behavior than others. By observing gradients and contour structure across the map, Caldera can provide a practical indication of which inputs appear more influential within current coverage and which appear to have weaker local effect.
- Interaction structureIn many processes, the effect of one variable depends on the level of another. Process maps can help indicate possible interaction structure, where combined adjustments appear to change local response behavior.
- Candidate operating regionsThe map can help screen candidate regions where the response appears favorable or practically useful within the explored domain, helping guide further validation.
Importantly, this representation also clarifies the boundaries of reliable interpretation. Regions better supported by experimental runs tend to show more consistent structure and lower uncertainty, while regions with weaker experimental support — including areas beyond current coverage or sparsely supported parts of the map — should be interpreted more cautiously.
By organizing sparse experimental data into an interpretable spatial structure, multivariate process maps allow engineers to reason about system behavior in a way that isolated plots or tables cannot provide.
Summary
Sparse experimental datasets are common in real engineering development.
Caldera provides a process-map view for interpreting limited experimental tables, using AI-assisted modeling to organize sparse experimental runs into an interpretable representation of the process space.
This perspective helps engineers:
- interpret sparse experimental runs more systematically
- screen candidate operating regions
- better interpret possible interaction structure within the explored process space