Caldera Technical Note #02
Reading Multivariate Effects and Interactions
AI-assisted interpretation of how multiple process variables jointly shape system behavior within current experimental coverage.
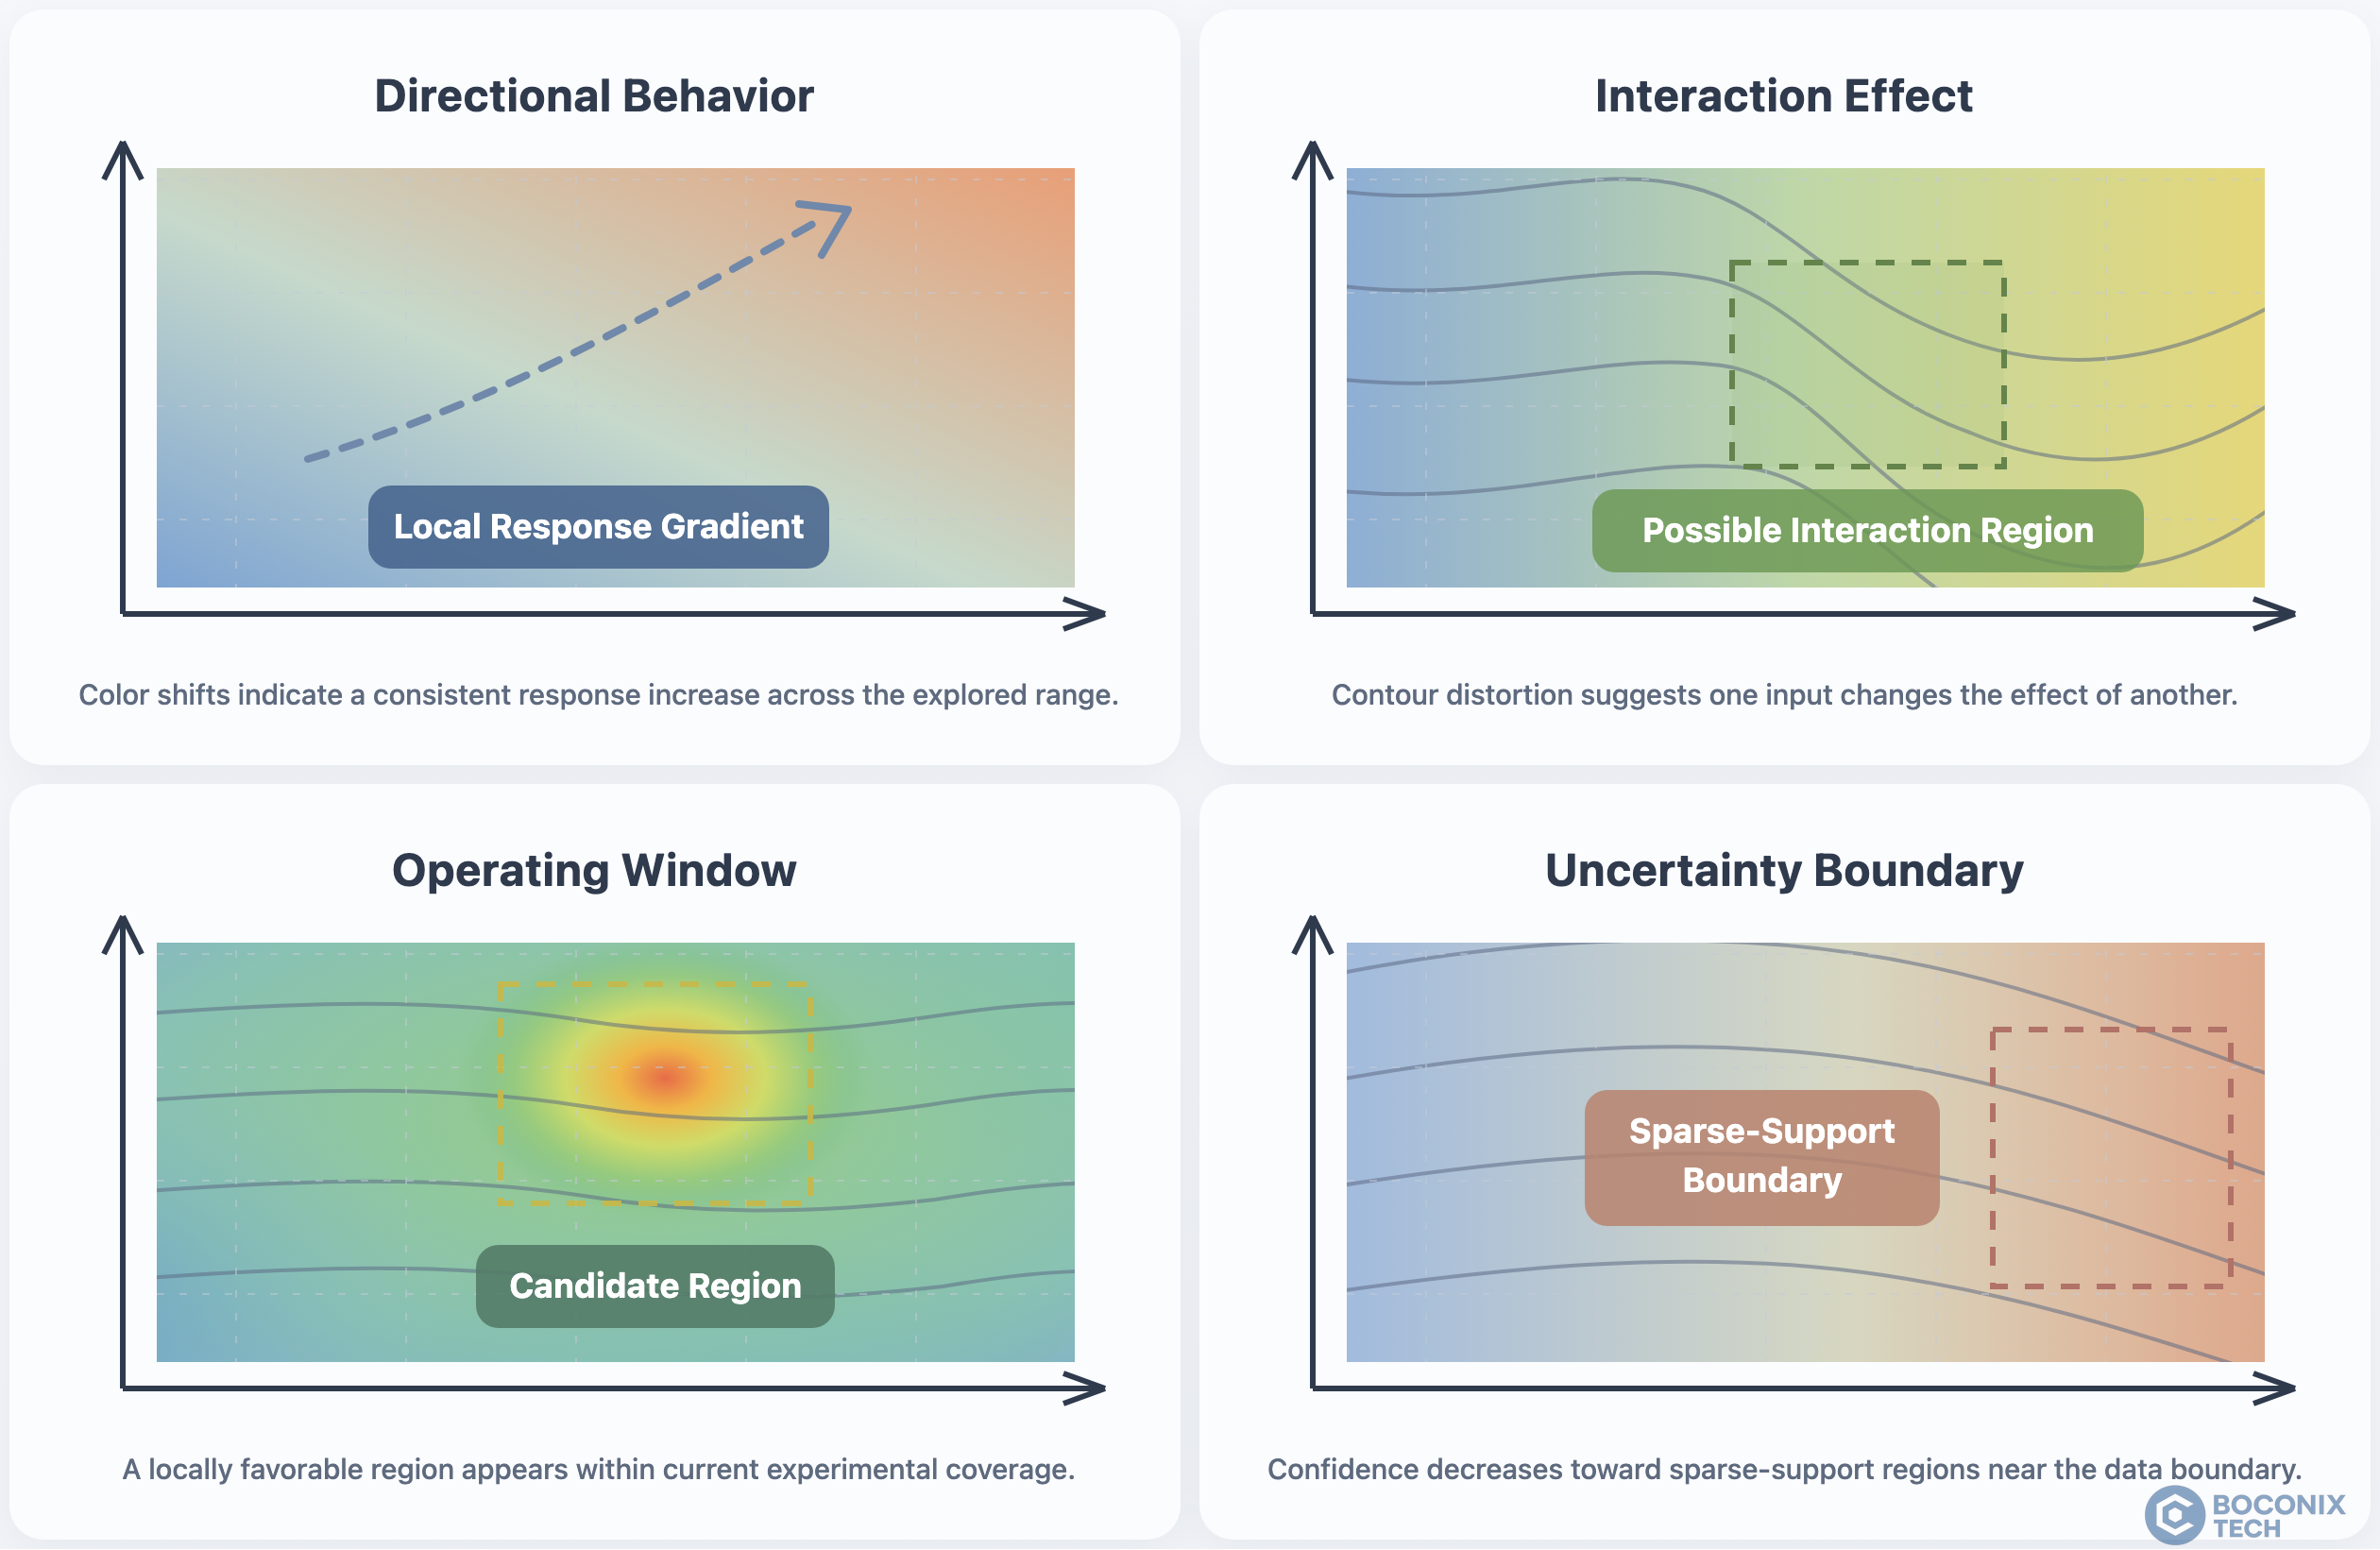
Figure 2. AI-assisted interpretation of directional behavior, possible interaction structure, candidate regions, and uncertainty boundaries in process maps.
Multivariate Influence in Sparse Experimental Systems
Most engineering responses arise from the combined influence of multiple process variables. Temperature, dwell time, composition, atmosphere, and pressure often act together to shape system behavior. In early development stages, experimental coverage across these variables is typically sparse, leaving only partial visibility of the parameter space.
Building on the process-map perspective introduced in Technical Note 01, the next step is interpreting how response behavior evolves across combinations of variables within this limited experimental coverage.
Reading Directional Behavior and Relative Variable Influence
The first step in interpreting a process map is identifying directional behavior across the parameter domain. AI-assisted process-map analysis examines how the response changes as process variables increase or decrease across the explored space.
In practice, this means looking at where the map changes quickly, where it changes more gradually, and which input directions appear to drive the largest response shifts within the currently explored domain. These directional patterns help engineers understand not only whether the response is increasing or decreasing, but also where the system appears more or less sensitive to local parameter changes.
Gradients across the map help indicate how strongly the system responds to parameter changes. Variables that consistently drive larger directional shifts across the explored region can be treated as more influential within current coverage, since they appear to exert stronger control over the local response structure.
Caldera combines AI-assisted process-map generation and analysis to summarize these influence patterns by examining gradients across the response surface and providing a practical indication of which process knobs appear more influential within the available experimental coverage. This should be interpreted as a coverage-dependent engineering indication rather than a formal global ranking of variable importance.
Interpreting Interaction Effects
In many process systems, the influence of one variable depends on the value of another. These interaction effects can appear as changes in gradient direction or response sensitivity across the map.
For example, increasing temperature may improve performance only within a certain dwell-time range. Outside that range, the same temperature increase may have weaker effect or produce a different response trend. In this sense, interaction is less about one variable acting alone and more about how the response surface changes across combinations of inputs.
AI-assisted process-map analysis helps interpret these structures by showing how response sensitivity changes across combinations of variables. In practice, interaction-like behavior may appear where contour shapes bend, spacing changes, or local gradient patterns shift across neighboring parts of the map. These visual changes can suggest that the effect of one process knob is not uniform throughout the explored domain.
This supports interpretation of possible interaction structure, rather than a formal interaction decomposition. The process map therefore serves as an engineering guide to where coupled behavior may matter most and where follow-up experiments may be most informative.
Screening Candidate Regions and Reading Uncertainty Boundaries
Once directional behavior and possible interaction patterns are understood, AI-assisted analysis can begin screening candidate regions where response behavior appears locally favorable and reasonably smooth within the explored domain.
These regions typically appear where the response is locally favorable and the surrounding contour structure remains reasonably smooth within current coverage. Such areas can serve as candidate regions for further validation, especially when teams are screening practical operating conditions rather than chasing a single isolated optimum. In many development settings, a compact region with coherent local behavior is more useful than a visually extreme point that may be fragile, poorly supported, or difficult to reproduce.
Near the edges of experimental coverage, however, the response structure becomes less certain. These areas form uncertainty boundaries, where limited experimental support makes interpretation less reliable. Uncertainty maps help indicate these practical boundaries by showing where data support becomes sparse and interpretation becomes less reliable.
This distinction is important because a process map may remain visually smooth even where confidence is beginning to weaken. Candidate regions and uncertainty boundaries should therefore be read together: one helps identify where follow-up work may be most practical, while the other helps indicate where conclusions should be treated more cautiously.
Summary
Reading a process map involves interpreting how response behavior evolves across multiple variables within the limits of experimental coverage. Rather than examining parameters independently, the process-map perspective reveals how variables jointly shape system behavior across the explored domain.
AI-assisted process-map generation and analysis supports process-map interpretation by summarizing response gradients, highlighting directional behavior, providing practical indications of more influential variables within current coverage, suggesting possible interaction structure, and showing where experimental support becomes sparse. Through this representation, candidate regions and uncertainty boundaries can be interpreted within limited experimental coverage. Together, these outputs provide a structured basis for decisions about operating conditions and further experimentation.